Full-Stack Data Analytics:
EXCEL SQL Python Power BI Tableau AI Integrated

Your data journey starts here. In just 60 days, we’ll take you from Excel basics to building AI-powered dashboards — live, hands-on, and guided every step of the way. This isn’t just another course. It’s a launchpad into a career where companies around the world are looking for exactly your kind of skills.

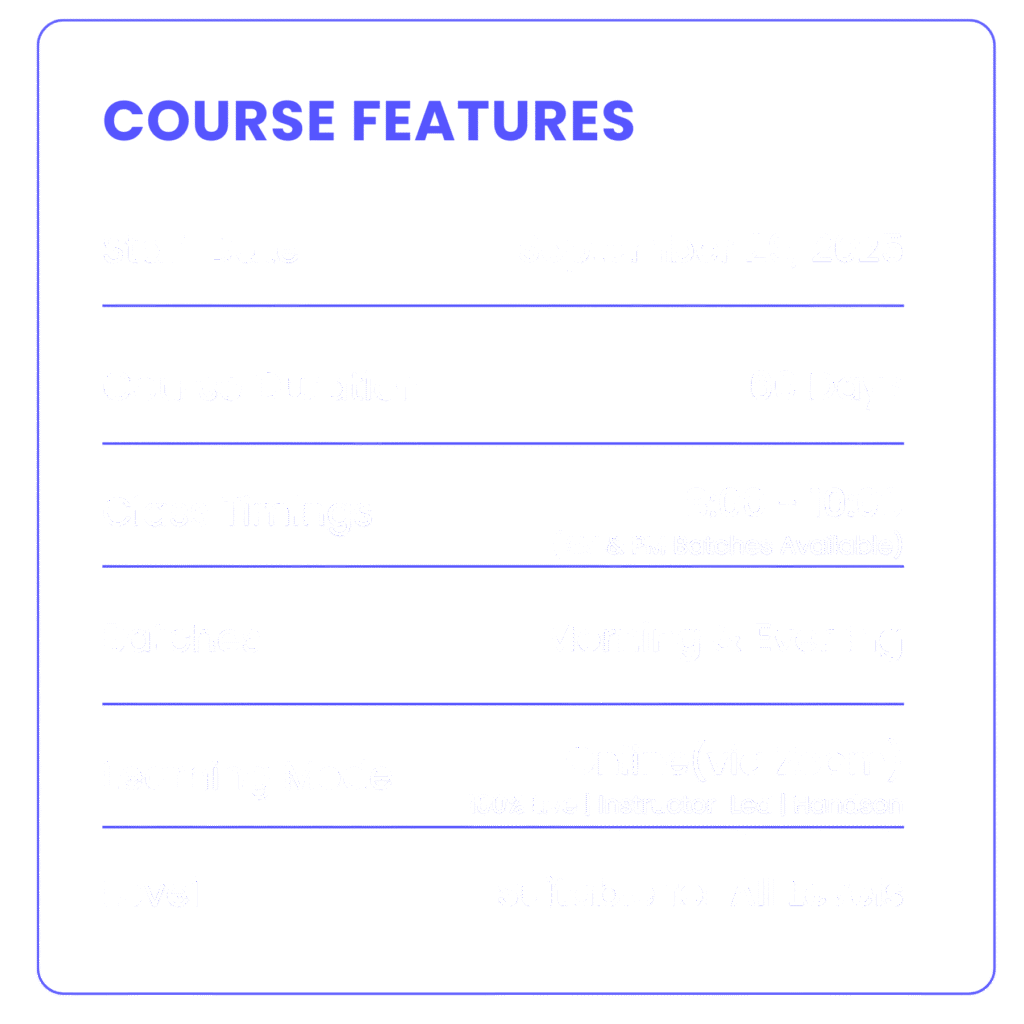
Course Duration:

60 Days

100% Live & HandsOn

Enrollment Closes In:

Days
Hours
Minutes
Seconds
Get Brochure

Why Data Analytics now?

The fastest-growing skill of the decade.

Every business today — from hospitals to e-commerce giants — runs on data. The challenge? They need people who can make sense of it. That’s why data analytics is one of the fastest-growing careers globally, with roles opening up every single day. By starting now, you’re positioning yourself at the heart of a future-proof industry.

"Don’t get left behind — while AI takes jobs, analytics creates them"

What Makes This Program Different?

Analytics opens doors. We help you walk through them.

Our program is fully live, interactive, and milestone-driven. Every session is about building, showcasing, and applying — not just listening. You’ll earn badges you can share, complete projects recruiters care about, and get 1:1 mentorship to guide you at every step. This isn’t just about learning tools — it’s about building confidence, industry-ready skills, and a career launchpad.

No pre-recorded videos. No fluff. Just hands-on, job-focused training that takes you from zero to career-ready in 60 days.

Highlights of our Program

Why us?

Global Standards

Training aligned with international benchmarks to match top industry expectations.

Expert Instructors

Learn directly from working professionals with real-time industry expertise.

Live Learning

100% interactive sessions with discussions, Q&A, and hands-on practice.

Flexible Timings

Morning and evening batches designed to fit your schedule.

Hands-On Projects

Build 8–10 real-world projects to showcase on your resume and in interviews.

Certifications

Earn badges for each milestone and certificates at every stage to validate progress.

Job & Placement Guidance

1:1 mentorship, mock interviews, and referrals to land your next job.

Resume & Profile Boost

Get resume reviews and a recruiter-ready LinkedIn profile.

LMS Access

Access recordings, assignments, and progress tracking anytime.

Simplified Learning Journey

A milestone-driven roadmap where every stage builds your skills, projects, and career confidence.

Tools & Skills You’ll Master

Course Outline

Core Topics Covered

  • Role of Data Analytics in today’s businesses

  • Types of analytics: Descriptive, Diagnostic, Predictive, Prescriptive

  • Understanding data types, databases, and workflows

  • AI in analytics → Smart reporting, automation, insights

  • Excel essentials: formulas, logical functions, formatting, productivity hacks

  • Advanced analytics with Excel: PivotTables, Power Query (ETL), Power Pivot (DAX)

  • Data visualization: charts, dashboards, scenario & what-if analysis

  • Automation: Macros & VBA for reports & workflows

  • AI in Excel → Forecasting, anomaly detection, insights

Hands-On Outcomes: Build AI-powered dashboards, automated KPI reports, and interactive financial & sales analysis tools.

  • Relational databases & SQL fundamentals

  • Querying techniques: SELECT, JOINs, GROUP BY, HAVING

  • Advanced SQL: Subqueries, CTEs, Window Functions, indexing

  • SQL for ETL: cleaning, transforming, preparing datasets

  • SQL + AI → Query optimization & natural language query assistants

Hands-On Outcomes: Clean and analyze raw datasets, build SQL pipelines, and integrate SQL with BI tools for reporting.

  • Python basics: syntax, control flow, functions

  • Pandas & NumPy for data wrangling and analysis

  • Data visualization with Matplotlib & Seaborn

  • Exploratory Data Analysis (EDA) with AI-generated narratives

  • SQL + Python integration for end-to-end data workflows

  • Python in BI tools → running scripts in Power BI/Tableau

Hands-On Outcomes: Deliver EDA reports with AI-driven storytelling, automate pipelines, and connect datasets across tools.

  • Getting Started with Power BI: Power BI Desktop, Service, Mobile

  • Data Integration: Importing from Excel, SQL, APIs, Cloud Sources

  • Power Query (ETL): Cleaning, merging, shaping, handling missing data

  • Data Modeling: Relationships (1:1, 1:N, M:N), star schema, hierarchies

  • DAX Essentials: Calculated columns, measures, filters, aggregations

  • DAX Advanced: Time intelligence (YTD, SAMEPERIODLASTYEAR), variables, CALCULATE optimization

  • Visualization Mastery: KPIs, advanced charts (waterfall, gauge, treemap, maps), custom visuals

  • Power BI Service: Collaboration, workspace management, publishing, row-level security

  • AI Integration in Power BI: Key Influencers, Q&A visuals, anomaly detection, Azure AI services

💡 Hands-On Outcomes: Build interactive business dashboards (Finance, HR, Marketing, Sales) enriched with AI-powered insights and publish them for collaboration.

  • Getting Started with Tableau: Desktop, Server, Online, Public versions

  • Connecting to Data: Excel, CSV, SQL, live vs extract connections, Tableau Prep for ETL

  • Data Management: Dimensions vs Measures, hierarchies, sets, bins, calculated fields

  • Visualization Essentials: Bar, Line, Pie, Scatter, Maps (geo-visuals), heatmaps, tree maps

  • Advanced Visualizations: Dual-axis, LOD Expressions (FIXED, INCLUDE, EXCLUDE), waterfall, Gantt, funnel, bullet charts

  • Dashboard Design & Interactivity: Actions, filters, parameters, storytelling features

  • Performance Optimization: Data extracts, workbook efficiency, advanced joins

  • AI in Tableau: Forecasting, trend lines, “Explain Data” AI-driven insights, predictive modeling integration

Hands-On Outcomes: Develop enterprise-level Tableau dashboards with predictive forecasting and AI insights, ready for professional portfolio showcases.

  • AI in Analytics: Forecasting, anomaly detection, clustering, text analysis

  • Predictive Analytics for Analysts: Linear & logistic regression basics, business-friendly ML models

  • Generative AI: Automated summaries, report generation, chatbot Q&A assistants

  • Sentiment & Text Analytics: Using AI to analyze customer feedback/social media

  • AI Automation in Workflows: Integrating APIs for alerts, reporting, and data pipelines

Hands-On Outcomes: Deliver an AI-driven business storytelling project — combining predictive analytics, natural language summaries, and interactive dashboards.

  • Capstone Project: An end-to-end business analytics case
    (Example: E-commerce sales → SQL & Python ETL → Power BI/Tableau dashboards → AI-powered forecasting & storytelling)

  • Group Presentations & Peer Reviews: Simulated boardroom/business scenario

  • Validation & Assessment: Industry mentor feedback + internal certification evaluation

  • Portfolio Integration: Align projects into GitHub, LinkedIn, and resume

Outcome: A portfolio-ready flagship project validated by industry experts, showcasing mastery across tools and AI-powered analytics.

--know more on porjects and case studies 

  • Resume & LinkedIn Optimization → We guide you to create ATS-friendly, AI-polished resumes and LinkedIn profiles that get recruiters’ attention.

  • Mock Interviews → Practice both Technical & HR rounds, get data-driven feedback, and improve until you feel confident.

  • Placement Assistance & Referrals →
    Exclusive recruiter connects, curated job boards, and referrals for top-performing students to MNCs.

  • Career Toolkit → Ready-to-use GitHub repos, portfolio templates, case study decks, and real project showcases.

  • Surprise Power Session → Interactive masterclasses from industry leaders on AI, Analytics, and emerging tech trends.

  • 1:1 Career Mentorship → Personalized guidance to build your career roadmap, select target job roles, and prep for interviews.

💡 Outcome: Graduate not just with skills, but with job-ready confidence, a polished portfolio, and active placement support.

--Know more about the Job/Placement Structure
🛈 For detailed project case studies, an in-depth course curriculum, milestones registration and exclusive program benefits, please refer to the brochure.

GLOBAL CERTIFICATION

Earn a certificate that’s verifiable worldwide and trusted by any employer

See the Pen Your Pen Title by Karthik (@karthik-yarramati) on CodePen.

  • Certificate ID – Your Unique Identity

    A globally unique code that makes your certificate official, verifiable, and impossible to duplicate — lasting proof of your achievement.

  • Repo ID – Verified on Record

    Your project/Dashbaords are Securely stored in Vyyoma’s global repository, your Repo ID provides lifelong validation for employers and institutions, ensuring your skills are always recognized.

  • Smart QR Code – Instant Validation

    A secure QR code that lets anyone instantly verify your certificate — displaying your name, completion date, Repo ID, validity, and digital proof in real time. (Ex: For HR verification)

  • Official Endorsement & Statement

    An official endorsement from your instructor/manager, recognizing your hard work with personalized details of your name, institution, tools mastered, and program achievements.

  • Level 1 Badge – Explorer

    Earned by mastering the foundations through daily LMS sessions, guided exercises, and consistent attendance — your first step into the world of data analytics.

  • Level 2 Badge – Achiever

    Awarded for applying skills in live classes, completing assignments on Excel, SQL, and Power BI, and proving you can turn learning into real results.

  • Level 3 Badge – Architect

    Reserved for those who excel across projects, dashboards, and AI tools — showcasing innovation, consistency, and leadership through the full 60-day journey.

  • Vyyoma Seal of Excellence – Gold Standard

    An exclusive global seal of trust and distinction — symbolizing Vyyoma’s internatioanl standards in learning, and recognizing your skills with international credibility. (3D Holographic Logo)

"We’re with you until you land your role."

Structured placement guidance

Career & Placement Highlights

Our program goes beyond just teaching skills — we shape you into a job-ready professional. With personalized mentorship, resume makeovers, mock interviews, and direct recruiter connects, you’ll graduate not only with knowledge but with the confidence, portfolio, and industry exposure to stand out in placements. Top performers also get referral letters to MNCs and guided interview prep, giving you an extra edge in landing your dream role.

Resume & LinkedIn Makeover

Mock Interviews

Placement Assistance

Career Toolkit

Power Sessions

1:1 Mentorship

Direct Referrals to top MNCs

Exceptional performers may be recommended to hiring managers at leading companies and employee level official referrals will be provided to them.

Guaranteed Interview Opportunities

Get up to 4 interview calls for Data Analytics roles, based on your performance and program engagement.

Spotlight Recognition

High achievers are highlighted on our official platform and LinkedIn network.

Who’s Hiring Data Analysts Today?

Companies that are looking for AI-Enhanced Data Analysts

From startups to Fortune 500s, every industry is racing to build data-driven teams.

Heartfelt Words

Testimonials & Reviews

LinkedIn Testimonial
Profile photo of John Doe

Sri Sravya kala

Senior Data Analyst · Infosys

The instructors are approachable and explain concepts with real-life examples. They made even complex topics like SQL joins and Power BI dashboards feel simple.
LinkedIn Testimonial

Siva Krishna Tirumani

Business Analyst · TCS

What I liked most about Vyyoma Trainings was the structure — clear milestones, projects, and support whenever we needed. The placement guidance part is an additional benfit that helped me a lot.
Student Review
Profile photo of Ravi Kumar

Sajal Singh

PES University · B.Tech Student · Karnataka

The training was very practical. I could apply what I learned in class directly in my project. The live sessions and assignments kept me on track.
LinkedIn Testimonial

Karthik Yarramati

Tableau Developer · TCS

The projects and mock interviews really helped. My resume finally stood out, and I got shortlisted for multiple roles.I got my first analytics job within 2 months of completing the course. The placement prep made all the difference.
Student Review
Profile photo of Ravi Kumar

Solmon Raju T

HCL · Hyderabad

From a non-CS background, I never thought I’d switch to analytics. With Vyyoma’s training, I secured an internship and later a full-time role.
Student Review
Profile photo of Ravi Kumar

Abhishek Danu

IMI University · New Delhi

I joined Vyyoma’s Data Analytics program while still figuring out my career path. The structured projects and interview prep helped me land my first role as a Junior Data Analyst. Grateful to the team for guiding me step by step.

About our Tutors and Mentors

Our trainers are not just teachers — they’re real practitioners. Every session is delivered by professionals working in top MNCs, bringing you hands-on knowledge, industry insights, and corporate-level expertise. You don’t just learn tools; you learn how they’re used on the job every day.

Industry Experience

Career-Focused Mentorship

Global Standard Teaching

Who Can Attend

Students & Fresh Graduates

Career Switchers

Early Career IT Professionals

Working Professionals

Entrepreneurs & Freelancers

Prerequisites

No prior coding required

Basic computer skills

Learning mindset

Laptop + Internet

Commitment to practice